“The Marxian view is that capitalistic economies are inherently unstable and that excessive accumulation of capital will lead to increasingly severe economic crises. Growth theory, which has proved to be empirically successful, says this is not true.
The capitalistic economy is stable, and absent some change in technology or the rules of the economic game, the economy converges to a constant growth path with the standard of living doubling every 40 years.
In the 1930s, there was an important change in the rules of the economic game. This change lowered the steady-state market hours. The Keynesians had it all wrong.
In the Great Depression, employment was not low because investment was low. Employment and investment were low because labor market institutions and industrial policies changed in a way that lowered normal employment.”
Obviously, I did not write the above. The author was instead Edward C. Prescott, who shared the 2004 Nobel Prize in Economics for the development of real business cycle theory, in his 1999 paper “Some Observations on the Great Depression” (Federal Reserve Bank of Minneapolis Quarterly Review, Winter 1999, vol. 23, no. 1, pp. 25– 31).
This statement is remarkable for a number of reasons I’ll discuss below. But though it is extreme, it does express a belief that is endemic in neoclassical economics, that a market economy is inherently stable and will always return to a stable growth path after a shock.
That common belief lies behind the expectations of economists that, now that the GFC has played itself out, the economy will return to trend growth and the emergency measures that attenuated its impact can be withdrawn.
From this perspective, the GFC was a “pothole in the road” caused by the Subprime crisis, a “change in the rules of the economic game” which is now behind us. With the damage caused by the crisis largely contained, normal economic growth can resume. Over time, the unemployment rate will return to pre-crisis levels as the economic car resumes its steady speed along the highway of history.
The alternative perspective is that the GFC was more akin to an abrupt change in the terrain. The “economic car” had been coasting downhill with the gravity of ever-increasing private debt adding to the speed of the car. With the GFC we reached the bottom of the hill, and the car now has to drive uphill as it attempts to maintain its previous debt-enhanced speed while also reducing debt.
Visually at least, the “change in terrain” analogy stands up better than the pothole. I normally show the debt to GDP ratio as a rising function, but the economy’s speed gets a boost as the increase in debt makes a positive contribution to aggregate demand, and is slowed down when deleveraging reduces demand. So turning the ratio upside down may give a better idea of the depth of the “Valley of Debt” into which we have fallen:

When Australia began its most recent descent into debt in mid-1964, the average annual increase of 4.2% in the ratio added only a trivial amount to aggregate demand—since at the time debt was a mere 25% of GDP. But at the end of the debt bubble in 2008, when debt had become 165% of GDP, that same rate of debt growth added a huge amount to demand—the economic “car” gained speed as the slope of the debt mountain increased.
We hit the bottom of that mountain in March 2008, and now we’re starting to climb out of the valley—though not yet in absolute terms, since thanks to the First Home Vendors Boost, mortgage debt is still growing as business busily delevers (see comments on the data, below). But once deleveraging takes hold, the acceleration caused by racing down Debt Mountain will be replaced by an economic car straining up the Mount Debt Reduction. This change in the terrain will constrain private economic performance until debt has fallen significantly, as it did after the 1890s and the 1930s.
A similar, if more extreme, picture applies in the USA, where private debt is now 300% of GDP. In contrast to Australia, the USA’s debt ratio began to rise as soon as WWII ended: on average, US private debt rose 2.9% faster than GDP every year until 2008, taking the debt ratio from 45% at the end of the War to 300% now. Deleveraging from this level of debt must exert a substantial break on economic performance, by diverting income from expenditure to debt reduction.
I am therefore one of a minority of economic commentators who regard “deflation and deleveraging” as the main dangers facing the global economy in the near future (curiously, this minority might include Australian Prime Minister Kevin Rudd). From my perspective, the Global Financial Crisis marks “a change in the terrain”: for decades, rising debt has turbocharged economic performance; now falling debt will be a drag on economic activity.
The vast majority of economists who perceive the GFC as a pothole on the road that is now behind us do not consider debt and deleveraging in their analysis. Their models have neither credit nor money nor private debt in them, so from their point of view, there is no terrain at all beneath the car—merely a long flat highway of history along which the economic car drives at the speed it is underlying “real” economic performance.
This failure to even consider the role of private credit in a capitalist economy is an endemic weakness in conventional “neoclassical” economics, which ignores the dynamics of credit for a variety of reasons that are both ideological and illogical.
The ideology is apparent in Prescott’s comments on the Great Depression, quoted above. The lack of logic is evident when you compare a key statement in that paper—that “Growth theory, which has proved to be empirically successful, says this is not true”—with the results of some very careful empirical research by the very same author just ten years earlier. There he (and co-author and Nobel Prize recipient Finn Kydland) concluded that the empirical data contradicted neoclassical growth theory:
“The purpose of this article is to present the business cycle facts in light of established neoclassical growth theory, which we use as the organizing framework for our presentation of business cycle facts. We emphasize that the statistics reported here are not measures of anything; rather, they are statistics that display interesting patterns, given the established neoclassical growth theory.
In discussions of business cycle models, a natural question is, Do the corresponding statistics for the model economy display these patterns? We find these features interesting because the patterns they seem to display are inconsistent with the theory.” (Finn E. Kydland & Edward C. Prescott, “Business Cycles: Real Facts and a Monetary Myth”, Federal Reserve Bank of Minneapolis Quarterly Review, vol. 14, no. 2, pp 3–18, p. 4).
One key pattern in actual economic data that went against the predictions of neoclassical economic theory was the relationship between broad measures of the money supply and government-created “Base Money”. The standard “money multiplier” view is that:
- The government creates “Base Money” via deficit spending, and credits that money to private individuals via social security, goods purchases etc.;
- These private individuals then deposit that money in bank accounts;
- The banks then retain a proportion of these deposits and lend out the rest, creating credit money (and debt).
If this view were empirically correct, then an analysis of money over time would show that “Base Money” was created first and “Credit Money” was created later, with a time lag.
In fact, what Kydland and Prescott found was that the empirical data was the opposite of this: credit money was created first, and Base Money was created later, with a lag of up to a year:
“There is no evidence that either the monetary base or M1 leads the cycle, although some economists still believe this monetary myth. Both the monetary base and M 1 series are generally procyclical and, if anything, the monetary base lags the cycle slightly.
The difference in the behavior of M1 and M2 suggests that the difference of these aggregates (M2 minus M1) should be considered. … The difference of M2-M1 leads the cycle by even more than M2, with the lead being about three quarters.
The fact that the transaction component of real cash balances (M 1) moves contemporaneously with the cycle while the much larger nontransaction component (M2) leads the cycle suggests that credit arrangements could play a significant role in future business cycle theory. Introducing money and credit into growth theory in a way that accounts for the cyclical behavior of monetary as well as real aggregates is an important open problem in economics.”
I couldn’t agree more, but this is not what neoclassical economists did. Instead they continued to develop models in which money and debt played no role.
Despite his excellent empirical work on monetary dynamics in “Real Facts and a Monetary Myth”, Prescott’s “Great Depression” paper made no reference to credit at all as an explanatory factor in the Great Depression. Instead—I’m not joking—he blamed the Depression on a “change in labor market institutions and industrial policies that lowered steady-state, or normal, market hours”.
Except for this bizarre argument that the Great Depression was the result of the voluntary response of workers to unspecified changes in labour market conditions that made labour less desirable, this lengthy quote from Prescott is representative of standard neoclassical thinking about crises like the GFC:
“Essentially, business cycles are responses to persistent changes, or shocks, that shift the constant growth path of the economy up or down. This constant growth path is the path to which the economy would converge if there were no subsequent shocks. If a shock shifts the constant growth path down, the economy responds as follows. Market hours fall, reducing output; a bigger share of output is allocated to consumption and a smaller share to investment; and more time is allocated to leisure. Over time, market hours return to normal, as do investment and consumption shares of output, as the economy converges to its new lower constant growth path. The level of the new path is lower, not the growth rate along the path.
I’ve just described the response of the economy to a single shock. In fact, the economy is continually hit by shocks, and what economists observe in business cycles is the effects of past and current shocks. A bust occurs if a number of negative shocks are bunched in time. A boom occurs if a number of positive shocks are bunched in time. Business cycles are, in the language of Slutzky (1937), the “sum of random causes.”
The fundamental difference between the Great Depression and business cycles is that market hours did not return to normal during the Great Depression. Rather, market hours fell and stayed low. In the 1930s, labor market institutions and industrial policy actions changed normal market hours. I think these institutions and actions are what caused the Great Depression.”
So the Great Depression was a conscious choice by American workers to enjoy more leisure, in response to unspecified changes in the labour market ([Later in the same essay, he states: “Exactly what changes in market institutions and industrial policies gave rise to the large decline in normal market hours is not clear.…”).
It would be bad enough if Prescott were merely an obscure academic economist, but he is far from obscure: he and Kydland shared the Nobel Prize in Economics for the development of neoclassical growth theory. As ridiculous as his argument is, it does accurately state the conclusions of the neoclassical “real business cycle” model. As is often the case, you find a much clearer—and therefore far more obviously absurd—statement of neoclassical economic theory when you go to the source, rather than relying on a second-hand account from a textbook or run-of-the-mill practitioner.
So the confidence that the vast majority of economists have that the GFC is now behind us, and the “normal” trend rate of growth will resume, is fundamentally based on the belief that credit and debt dynamics do not matter.
I beg to differ. Though the enormous government stimulus has attenuated the immediate impact of debt deleveraging, it has done nothing to reduce the outstanding level of private debt. Instead even sub-par growth has become dependent on continuing government stimuli, and whenever those stimuli are removed, the economy will falter.
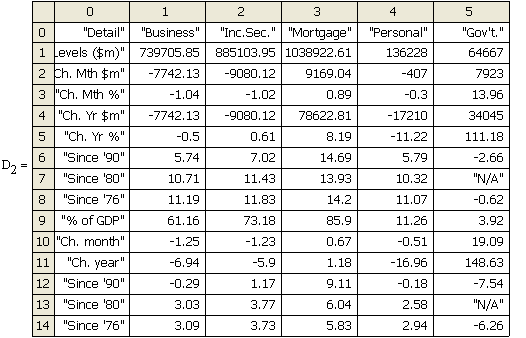
Total private debt rose by a mere A$1 billion last month, versus as much as A$30 billion during the height of the debt bubble. But were it not for the First Home Vendors Boost (let’s call it what it is), Australia would now be firmly in the grips of deleveraging.
END OF COMMENTARY
COMMENTS ON THE DATA—A Mortgage & Government Led Recovery?

Total private debt rose by a mere A$1 billion last month, versus as much as A$30 billion during the height of the debt bubble. But were it not for the First Home Vendors Boost (let’s call it what it is), Australia would now be firmly in the grips of deleveraging.
Nonetheless the debt to GDP ratio fell yet again, because the rate of growth of debt is now substantially below the rate of growth of GDP—even though that is now also anaemic.

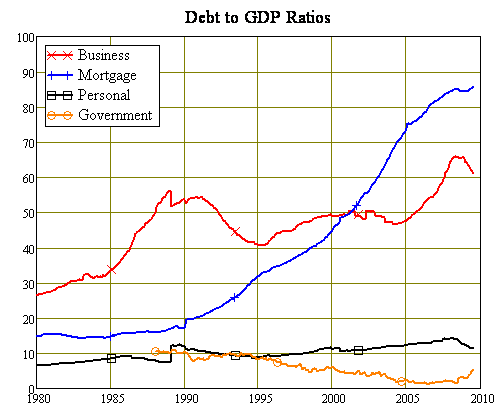
The breakdown of debt shows that the business sector is rapidly deleveraging, while mortgage and government debt is escalating—and both those are the result of government policy.
Without the First Home Vendors Boost, it is highly unlikely that mortgage debt would still be rising today. Mortgage debt peaked as a percentage of GDP in March 2008, and fell for the remainder of the year until the First Home Vendors Boost.
The quarterly change in mortgage debt was also trending down from the 2005 peak, and that downward trend has clearly been reversed by the impact of the Boost.


House Prices

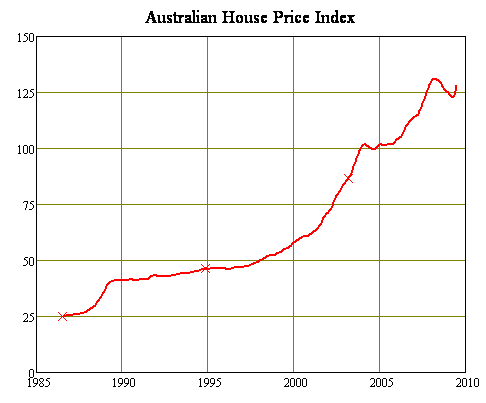
The Boost has certainly had the impact the government desired, of arresting the fall in Australian house prices.

It will also almost certainly guarantee that I’ll be walking (and running) to Kosciuszko under the first half of the bet with Rory Robertson.[1] The second half of the bet, that the fall from peak to trough will be of the order of 40%, may still see Rory also walking some years hence—and the withdrawal of the Boost may make this occur sooner rather than later.
The reason is twofold. Firstly, the Boost has obviously brought forward some buying by First Home Buyers that would have occurred anyway, as well as enticing in others who might not have considered it otherwise. The withdrawal of that demand will have a strong impact on the sub-$500,000 price range.
But the withdrawal will also affect houses in the $1 million to $1.5 million range as well, because the Boost did far more than merely boost sub-$500,000 prices.
First Home Buyers who were enticed into the market by the additional $7,000 geared that up with additional debt by at least a factor of 4, to result in something like a $35,000 price jump for sub-$500K houses. But the sellers of those houses—the real beneficiaries of the Boost—then received an extra $35,000 in cold hard cash. They then used this as a boost to their own deposits on their purchases of houses further up the chain—and if they also geared by a factor of 4 (ie a 80% marginal level of gearing, which is well within current lending practice), then the prices they paid for houses in the $750K‑1.5M range would have risen by $140,000.
This works in reverse as well. When the Boost is withdrawn, not only will sellers of sub-$500K houses find that buyers have $35K less to spend than during the boost, the sellers of $750K‑1.5M abodes will find their buyers short about $150K compared to during the boost.
2010 could be an interesting year for Australian house prices.
[1] If the index breaks its current maximum level of 131 in the next release of ABS 6416, I will walk (and run) from Parliament House to Mt Kosciusko as required by the bet in the last weeks of February 2010.

