I first realised that the world faced a serious financial crisis in the very near future in December 2005, as I prepared an Expert Witness Report for the NSW Legal Aid Commission on the subject of predatory lending.
My brief was to talk about the impact of such contracts on third parties, since one ground to overturn a loan contract was that it had deleterious impacts on people who were not signatories to the contract itself. I was approached because the solicitor in the case had heard of my academic work on Hyman Minsky’s “Financial Instability Hypothesis”.
Minsky’s hypothesis argued that a capitalist economy with sophisticated financial institutions could fall into a Depression as an excessive buildup of private debt occurred over a number of financially-driven business cycles. I had built a mathematical model of Minsky’s hypothesis in my PhD, which generated outcomes like the one shown below: a series of booms and busts lead to debt levels ratcheting up over time, until at one point the debt-servicing costs overwhelmed the economy, leading to a Depression.
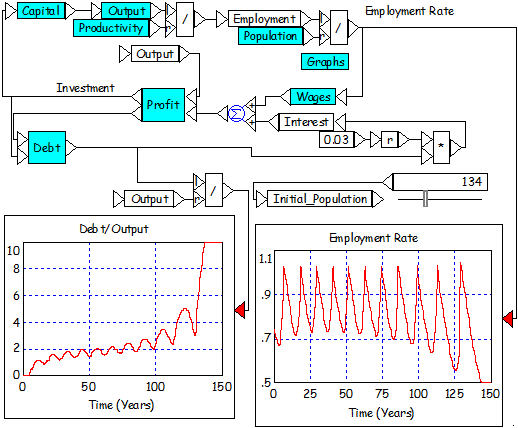
Figure 1
When I began writing my Report, I started with the comment that “debt to GDP levels have been rising exponentially”. But since I was an Expert Witness in this case rather than the Barrister, I knew that I couldn’t rely on hyperbole–and if the trend of growth wasn’t exponential, then I couldn’t call it that. I expected that there would be a rising trend, but that it wouldn’t be quite exponential, so I would need to amend my initial statement.
I downloaded the data on Australian private debt and nominal GDP levels from the RBA Statistical Bulletin, plotted one against the other, and my jaw hit the floor: the trend was clearly exponential. The correlation coefficient of the data since mid 1964 with a simple exponential function was a staggering 0.9903. The only thing that stopped the correlation from being absolutely perfect were two super-bubbles (on top of the overall exponential trend) in 1972–76 and 1985–94.
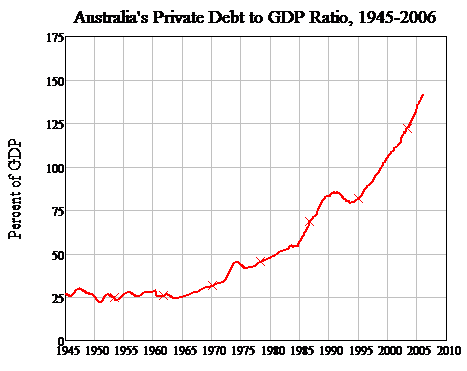
Figure 2
I expected that the situation in America would be as bad or worse, which was confirmed by a quick consultation of the Federal Reserve’s Flow of Funds data. Though not as obviously exponential as in Australia’s case, the correlation with simple compound growth was still 98.8%.
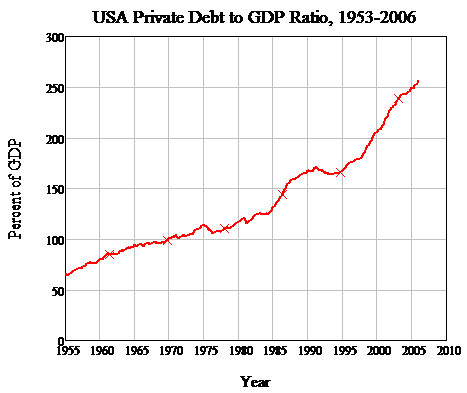
Figure 3
So debt had been growing faster than GDP–4.2% per annum faster in Australia’s case for over 40 years, and 2.7% faster for longer in the USA’s. An unsustainable trend in debt had been going on for almost half a century.
Staring at those graphs (at roughly 3am in Perth, Western Australia), I realised that these debt bubbles had to burst (and probably very soon), that a global financial crisis would erupt when they did, that someone had to raise the alarm, and that given my knowledge, that someone was me. As soon as my Expert Witness Report was finished, I started making comments in the media about the likelihood of a recession.
Less than 2 years later, the Global Financial Crisis erupted, and economists who didn’t see it coming, and who for decades had argued that government spending could only cause inflation, suddenly called for–and got–the biggest government stimulus packages in world history to prevent an economic Armageddon.
To some degree, the government stimulus packages worked.
I am happy to admit that the scale of the government countermeasures surprised me. As Australia’s Prime Minister Kevin Rudd pointed out, the collective stimulus over the 3 years from September 2007 till September 2010 was expected to be equivalent to 18 percent of global GDP. That was huge–bigger in real terms than the US’s military expenditure during World War II.
That huge government stimulus has attenuated the severity of the crisis, and led to positive growth figures in many countries–most notably Australia, which recorded only one quarter of falling GDP versus a norm of 4 consecutive quarters for most of the OECD. But it still has not addressed the cause of the crisis–the excessive level of private debt, and the transition from a period of decades in which rising debt fuelled aggregate demand, to one in which the private sector’s attempts to reduce debt will subtract from aggregate demand.
For that reason, I do not share the belief that the GFC is behind us: while the level of private debt remains as gargantuan as it is today, the global economy remains financially fragile, and a return to “growth as usual” is highly unlikely, since that growth will no longer be propelled by rising levels of private debt.
Private debt has, as in past downturns, started to fall compared to GDP–though in Australia’s case the so-called “First Home Owners Boost (which doubled the amount of money the government gave to first home buyers from A$7,000 to A$14,000) enticed so many new entrants into mortgage debt that Australia’s ratio started to rise again in mid 2009.
America’s ratio, on the other hand, continued to rise through the start of the GFC, but is now clearly falling.
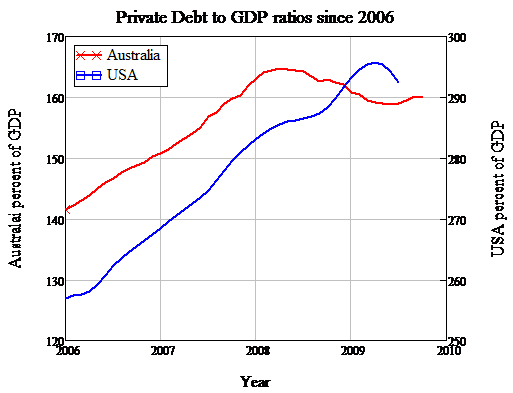
Figure 4
Having driven demand higher every year since the 1990s recession by rising and rising faster than nominal GDP, private debt is now falling and reducing aggregate demand. This is deleveraging at work, and it is the force that governments are trying to resist by boosting their own spending as private spending stagnates.
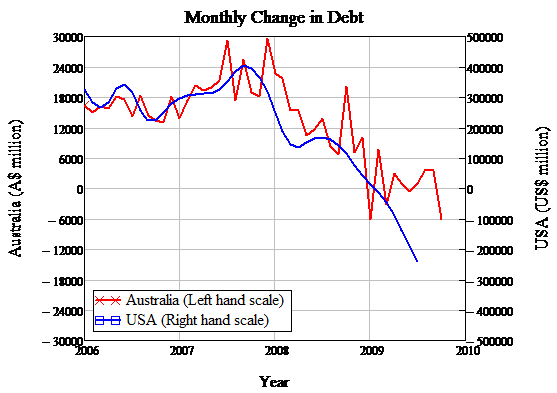
Figure 5
Australia’s success in avoiding a recession has been partly due to the fact that its policies encouraged private debt to grow again, as first home buyers took the additional A$7,000 of government money to the banks and borrowed against it (but even there, debt reduction by business and the reduction in personal debt is counteracting the rise in mortgage debt).
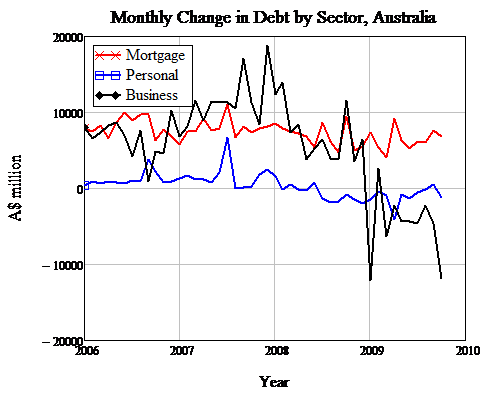
Figure 6
This is one foolproof means to avoid a serious recession–go back to borrowing and spending up big. This is, after all, what ended the recession of the 1990s–and in the USA’s case, it happened without debt actually falling. Australia’s greater recession then was due to the fact that debt did actually fall between 1991 and 1993, so that deleveraging drastically reduced aggregate demand.
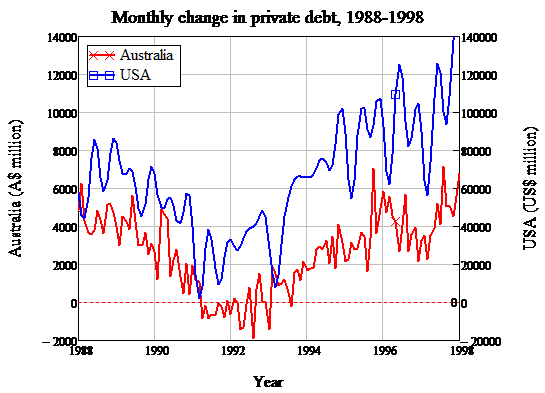
Figure 7
So could the global economy get out of the global financial crisis the same way it got out of the 1990s recession–by borrowing its way up? That’s where the sheer level of debt becomes an issue–and it’s why I stuck my neck out and called the GFC, because I simply didn’t believe that we could borrow our way out of trouble once more. Debt did continue rising relative to GDP for several years after I called the GFC, but it has now reached levels that are simply unprecedented in human history.
For the “borrowing our way out” trick to work once more, we would need to reach levels of debt that would make today’s records look like a picnic. What are the odds that that could happen again?
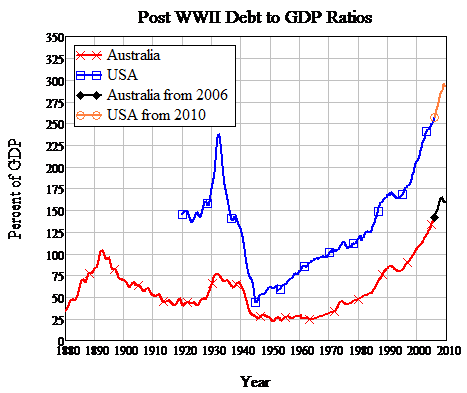
Figure 8
The debt servicing burden
The simplest measure of the impact of debt levels on the economy is to look at the ratio of interest payments to GDP. There are obviously two factors here: the level of interest rates, and the ratio of debt to GDP. A very high rate of interest–such as applied during the 1970s–can mean that even a low level of debt (relative to income) is hard to service; conversely, a low rate of interest–such as we have now–can be hard to service if debt levels are very high.
The next two charts illustrate this for Australia and the USA by recording interest rates on the vertical axis and the debt to GDP ratio on the horizontal. The smooth curves on the charts show combinations of the debt to GDP ratio and the rate of interest that require the same proportion of GDP to be devoted to debt servicing. The jagged lines show the actual progress of the debt servicing burden over time in both countries–starting from 1959 in Australia’s case and 1971 in the USA’s (the earliest date for my data on US average interest rates). The diagrams tell an interesting story about the evolution of the Ponzi financial system we now inhabit.
Back in 1960, debt servicing in Australia required a mere 2% of GDP. This rose rapidly to a peak of 16.7% of GDP in 1990–the beginning of Australia’s most severe post-War recession–as both interest rates and the debt to GDP ratio rose.
Then the servicing costs plummeted dramatically in the aftermath to the 1990s recession, as the Reserve Bank drastically cut rates–in the belated realisation that they had set them far too high in the late 80s in an attempt to control the asset bubble of that decade–and as the debt to GDP ratio fell (as did the actual debt level) during the recession.
Then Australia bounced along an 8% debt burden contour between 1993 and 2000, as interest rates fell while debt levels–driven by rising mortgage debt–rose.
Next the burden began to rise from 2003, as mortgage and business debt both expanded and the RBA began increasing rates to attempt to control the booming economy.
Rates then reached their peak in mid-2008 when the RBA finally realised that, rather than inflation being the main danger facing the economy, we were actually in a financial crisis. At this point, the debt servicing burden on the economy was the same as it was in 1990–even though rates were half what they were then–because the private debt to GDP ratio had doubled in the meantime.
The RBA went rapidly into reverse–cutting rates at 1% a month after having previously increased them in 1/4% steps. The debt ratio started to fall, and the debt servicing burden fell back to 10.25% of GDP–from where it is now rising once more as First Home Buyers pile on more debt, and the RBA is back once again fighting the mythical dragon of consumer price inflation (though recent comments imply it is also finally targetting house price inflation too).
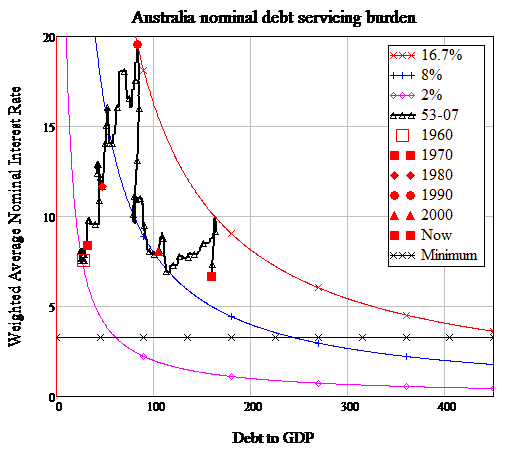
Figure 9
The American story is similar, but involves much larger levels of debt and a consequently higher debt servicing burden. This began at over 5% of GDP in 1971, and rose to a massive 23.4% of GDP in 1981–a different date to Australia’s, but also the time of the USA’s worst post-War recession (this is not a coincidence). Average interest rates peaked at 19.75% under Volcker in mid 1981.
The burden then fell rapidly as rates were cut significantly, only to rise once more as the 1980s stock market bubble took off, and the Volcker Fed tried to restrain the bubble once more with rising rates.
Then the 1987 crash hit, followed by the 1990s recession, and under Greenspan rates were pared back as the debt to GDP ratio actually fell for a time.
Then the DotCom bubble began, and debt began to rise once more–and the Subprime bubble commenced in the background. The Fed responded to the DotCom bust of 2000 with a rapid cut in its rate that drove average rates down from around 9% to just 4.4%, while at the same time rising mortgage and financial sector debt pushed the aggregate debt ratio past the Great Depression record of 235% of GDP.
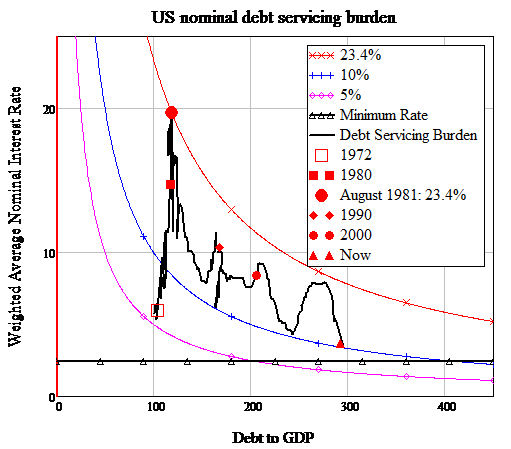
Figure 10
The Fed, firstly under Greenspan and then Bernanke, tried to restrain the bubble with rising interest rates once more–until the Subprime Catastrophe hit and it once again went into reverse, driving its own rate down to zero and the average rate to about 3.5%. That is where the USA now wallows, with a debt burden of almost 300% and a debt servicing burden of 10% of GDP.
Both countries now have lower average interest rates than they had back in the 1960s, but a debt servicing burden that is many times higher (five times higher in Australia’s case and double in America’s) because both Central Banks obsessed about the rate of consumer price inflation, while ignoring rampant growth in private debt.
And it’s actually worse than that when one considers the longer term.
Deflation and Depressions
There are actually two ways to reduce your debt burden–by paying it down yourself, or by letting inflation do it for you. So to gauge the real impact of debt on an economy, you have to consider the after-inflation rate of interest–and when inflation is high, this can actually be negative.
Conversely, when deflation strikes, the real rate can be higher–much higher–than the nominal rate. This is why Fisher called his theory “the Debt-Deflation Theory of Great Depression”–because debt on its own was nowhere near as dangerous as deflation. Considering the real debt servicing burden emphasises how much danger we are in now. The two big Depressions of the last one and a half centuries–the 1890s and the 1930s–had substantial deflation–with prices falling at up to 15 percent per annum in the 1890s, and over 10 percent per annum for two years during the Great Depression. That meant that even a low nominal rate of interest was a huge real rate.
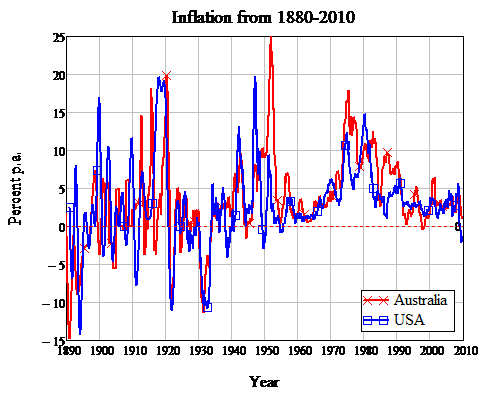
Figure 11
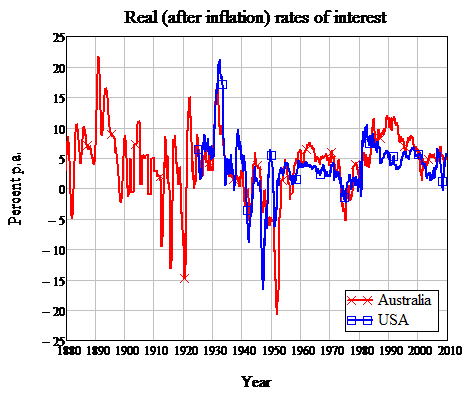
Figure 12
Conversely, periods of high inflation in the post-WWII period have meant that even high nominal rates meant low–and in some cases negative–real interest rates (it was cheaper to borrow money now and pay it back later than it was to avoid debt).
The effect of inflation drastically transforms the interest payment burden map–and it emphasises the dangers in the low inflation environment we are now in.
For Australia, the worst real burden of debt servicing occurred in the 1890s, when our debt to GDP ratio was higher than in the 1930s, and deflation drove the real rate of interest to over 20 percent. At that point, 19% of Australia’s GDP was needed to service debt–and the economy fell into a deep Depression (worse than the Great Depression) as a result.
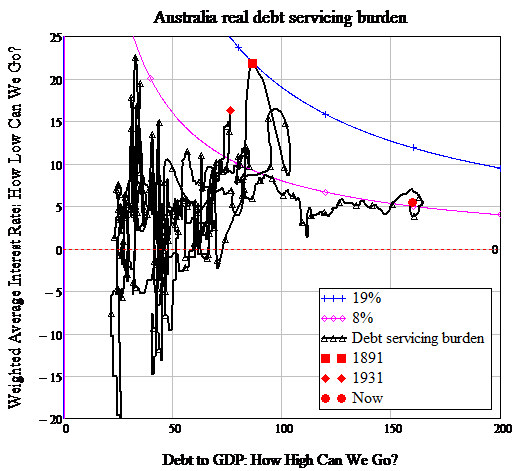
Figure 13
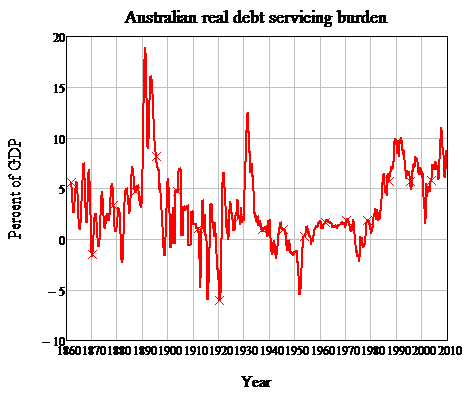
Figure 14
I don’t have data on 1890s debt levels in the USA, but I doubt that it could compare the the Great Depression in that country, as the real debt repayment map below emphasises. The combination of–until then–an unprecedented level of private debt and steep deflation meant that the real debt burden on the economy consumed 50% of GDP (using Moody’a Baa rate as a proxy for the average interest rate).
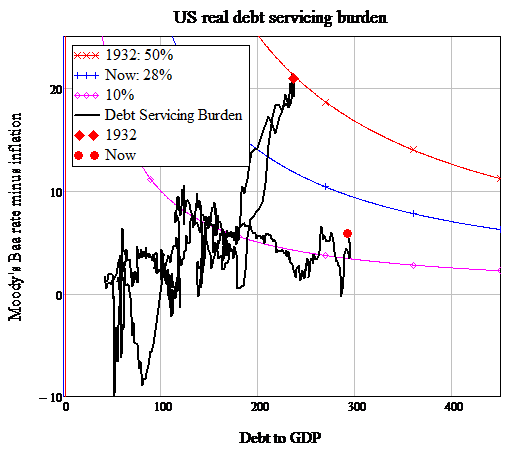
Figure 15
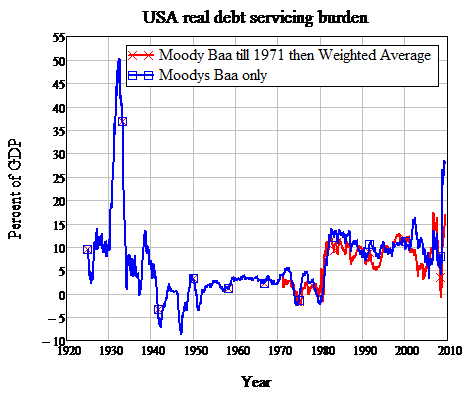
Figure 16
All of the above points out how dangerous a situation we are in with inflation rates as low as they have been driven by globalisation and by Central Banks that have obsessed about the rate of consumer price inflation and ignored both asset price inflation and the debt levels that have driven it.
In Australia’s case, all it would take is a 6% change in the real interest rate to put us back in the same situation we were in during the 1890s–because debt today is about 65% higher than back then.
In America’s case, a much larger jump of 11.5% is required to bring it back to the 1930s situation–but that’s before we take into account the impact of deflation on the debt ratio itself, since deflation actually increases the real debt burden as well as increasing real interest rates. That effect was drastic during the Great Depression: the US’s debt ratio rose from 175% to 235% even as debt fell from $162 billion to $125 billion.
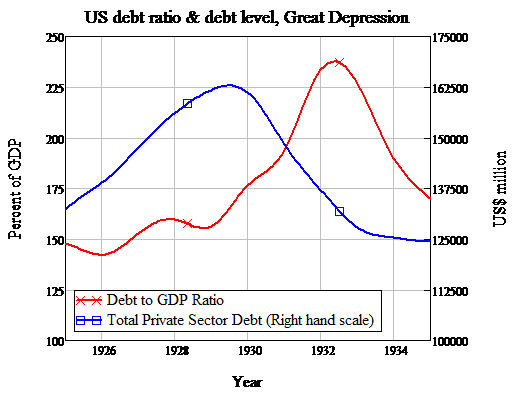
Figure 17
If a similar effect applied this time and deflation drove private debt levels to 400% of GDP, it would only take a 6% rate of deflation to put America in the same position it was in in 1932.
I hope this review establishes why the debt to GDP ratio is such an important indicator of financial fragility, and why as a consequence the GFC is far from over.
Only one question remains: why do Central Banks ignore the debt to GDP ratio?
There is nothing more dangerous than a bad theory
The simple reason is: because they are neoclassical economists. You don’t get to be a Central Banker without a degree in economics, and the school of thought that dominates economics today is known as neoclassical economics. Though a lot of what it says appears to be superficially intelligent, almost all of it is intellectual drivel, as I outlined in my book Debunking Economics (which summarised a century of profound critiques of this theory which its practitioners have studiously ignored).
Since critiques by economists and mathematicians of this theory have literally filled books, I won’t try to go into all of them here. Just three key neoclassical myths suffice to explain why they do not understand the dynamics of our credit driven society. They believe that:
(1) The nominal money supply doesn’t affect real economic output;
(2) The private sector is rational while the government sector is not; and
(3) That they can model the economy as if it is in equilibrium.
The first myth means that they ignore money and debt in their mathematical models: most neoclassical models are in “real” terms and completely omit both money and debt. So since debt doesn’t even turn up in their models, they are unaware of its influence (even though their statistical units do a very good job of recording the actual level of debt).
The second myth means that they are quite willing to obsess about government debt, but they implicitly believe that private debt has been incurred for sensible reasons so that it can’t cause any problems.
The third myth means that they ignore evidence that indicates that the economy is very far removed from equilibrium, and they misunderstand the effect of crucial variables in the disequilibrium environment in which we actually live.
I can give two instances of how this has affected attempts to get Central Bankers to realise that the debt to GDP ratio matters: Ben Bernanke’s discussion of Irving Fisher’s “Debt Deflation Theory of Great Depressions”, and a discussion I had with a Assistant Governor of Australia’s Reserve Bank on the topic.
Bernanke an expert on the Great Depression?
Ben Bernanke got his current position largely on the basis of his reputation as an expert on the Great Depression. In his Essays on the Great Depression, he explained why most economists ignored Irving Fisher’s theory of how the Depression occurred–which emphasised the importance of debt and deflation:
“The idea of debt-deflation goes back to Irving Fisher (1933). Fisher envisioned a dynamic process in which falling asset and commodity prices created pressure on nominal debtors, forcing them into distress sales of assets, which in turn led to further price declines and financial difficulties. His diagnosis led him to urge President Roosevelt to subordinate exchange-rate considerations to the need for reflation, advice that (ultimately) FDR followed. Fisher’s idea was less influential in academic circles, though, because of the counterargument that debt-deflation represented no more than a redistribution from one group (debtors) to another (creditors). Absent implausibly large differences in marginal spending propensities among the groups, it was suggested, pure redistributions should have no significant macroeconomic effects.” (Bernanke, 1995 p. 17).[1]
Though Bernanke notes that Fisher “envisioned a dynamic process”, his statement of why neoclassical economists ignored his theory is inherently couched in equilibrium terms–it sees debt-deflation as merely redistributing income from one group in society (debtors) to another (creditors). How can aggregate demand fall so much, if all that is happening is a transfer of income and wealth from one group of consumers to another?
However when one thinks in truly dynamic terms, income is not all there is to aggregate demand. In a dynamic setting, aggregate demand is not merely equal to income, but to income plus the change in debt.
During a debt-driven financial bubble–which is the obvious precursor to a debt-deflation–rising levels of debt propel aggregate demand well above what it would otherwise be, leading to a boom in both the real economy and asset markets. But this process also adds to the debt burden on the economy, especially when the debt is used to finance speculation on asset prices rather than to expand production–since this increases the debt burden without adding to productive capacity.
When debt levels rise too high, the process that Fisher described kicks in and economic actors go from willingly expanding their debt levels to actively trying to reduce them. The change in debt then becomes negative, subtracting from aggregate demand–and the boom turns into a bust.
Debt has little impact on demand when the debt to GDP ratio is low–such as in Australia in the 1960s, or the USA from the start of WWII till the early 60s. But whenever the debt to GDP ratio becomes substantial, changes in debt come to dominate economic performance, as can be seen in the next two charts.
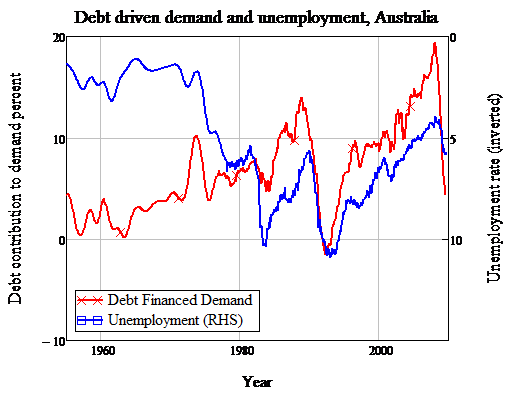
Figure 18
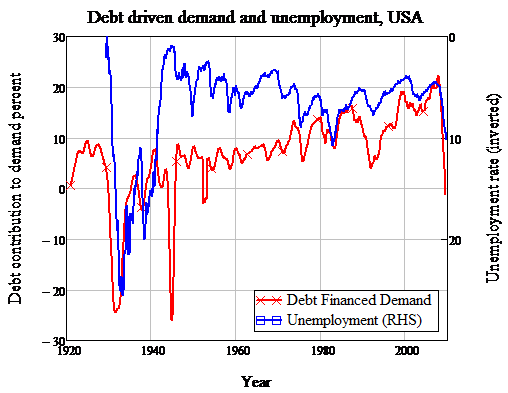
Figure 19
It is this effect that eluded Bernanke and his neoclassical brethren, because of their insistence on trying to model the world as if it is always in equilibrium. The debt-driven demand process is obvious when you think dynamically, but if you try to put it into an equilibrium straightjacket–as neoclassical economists did–then you can’t understand it at all.
A “schoolboy error”?
In 2008 I spoke at a seminar in Adelaide that was also addressed by Guy Debelle, an Assistant Governor (Financial Markets) of the RBA. After my talk he commented that he couldn’t understand why I compared debt to GDP, since that was comparing a stock to a flow.
I was rather nonplussed by the question–to me, the reasons why it matters are obvious–but I attempted an answer and thought little more about the incident.
Some time later, Debelle’s ex-colleague and good friend Rory Robertson of Macquarie Bank repeated Debelle’s observations in his interest rate newsletter, parts of which were then republished on a number of business blogs, including Business Spectator. Amongst other things, Rory remarked that:
Dr Steve Keen amongst others continues to make the schoolboy error of comparing debt to income (a stock to a flow — apples to oranges) and misses the main game. (Rory Robertson)
The proposition that comparing debt to GDP is making a stock/flow error may appear wise at first glance, but it is in fact nonsense. It instead shows that the person making the comment does not understand dynamics–which is a failing shared by almost all neoclassical economists.
In dynamic terms, the ratio of debt to GDP tells you how many years it would take to reduce debt to zero if all income was devoted to debt repayment. That is an extremely valid indicator of the degree of financial stress a society (or an individual) is under.
I find that members of the general public understand this easily. Only economists seem to have any trouble comprehending it–not because it is difficult but because their own training pays almost no attention to dynamic analysis, and therefore they don’t learn–as systems engineers do–that stock/flow comparisons can be extremely important indicators of the state of a system.
Marching ignorantly forward
With such ignorance about the dynamics of debt, academic economists and Central Banks around the world are hoping that the crisis is behind them, even though the cause of it–excessive levels of private debt–has not been addressed. They are recommending winding back the government stimulus packages in the belief that the economy can now return to normal after the disturbance of the GFC.
In fact “normal” for the last half century has been an unsustainable growth in debt, which has finally reached an apogee from which it will fall. As it falls–by an unwillingness to lend by bankers and to borrow by businesses and households, by deliberate debt reductions, by default and bankruptcy–aggregate demand will be reduced well below aggregate supply. The economy will therefore falter–and only regular government stimuli will revive it.
This however will be a Zombie Capitalism: the private sector’s reductions in debt will counter the public sector’s attempts to stimulate the economy via debt-financed spending. Growth, if it occurs, will not be sufficiently high to prevent growing unemployment, and growth is likely to evaporate as soon as stimulus packages are removed.
The only sensible course is to reduce the debt levels. As Michael Hudson argues, a simple dynamic is now being played out: debts that cannot be repaid, won’t be repaid. The only thing we have to do is work out how that should occur.
Since the lending was irresponsibly extended by the financial sector to support Ponzi Schemes in shares and real estate, it is the lenders rather than the borrowers who should feel the pain–which is the exact opposite of the bailout mentality that dominates governments around the world.
Unfortunately, it will take a sustained period of failures by conventional policy before unconventional policies, like deliberate debt reduction, will gain political traction. Implementing them will require both a dramatic change of mindset and probably also a widespread changing of the political guard.
It will also require the breaking of the hegemony of neoclassical economics over economic thinking, but I doubt that the academic profession, or economists in Central Banks and Treasuries, are up to the task of changing their spots. Change in economics will have to come from the rebels, and from outsiders taking over a discipline that economists themselves have failed.
The second decade of the 21st century promises to be a dramatic one, politically and economically.
[1] Bernanke went on to develop his own interpretation of Fisher which I won’t bother with here because I don’t think it’s worth the effort.

